 AIPL RESEARCH REPORT GENOMIC2 (04-12) |
Use of chromosomal predicted transmitting abilitiesJ. B. Cole and D. J. NullAnimal Improvement Programs Laboratory, Agricultural Research Service, USDA, Beltsville, MD 20705-2350 301-504-8334 (voice) ~ 301-504-8092 (fax) ~ john.cole@ars.usda.gov ~ http://aipl.arsusda.gov/ |
Query results || Query controls || Use of query results || References || Acknowledgments
The changes made for August 2009 genetic evaluations included the launch of a public query to display chromosomal predicted transmitting abilities (PTAs) for all genotyped animals. Because of the the recent availability of reliable haplotypes for most genotyped animals and the interest in those data, the query was modified to display that information. The original query was provided without documentation, but the new query provides more data and options that need to be described. In particular, users should understand the limitations of the data so that they can make informed decisions based on query results.
This document describes changes made to that query in April 2012, which include:
- A new view type that displays direct genomic values (DGVs) for paternal and maternal haplotypes for each chromosome.
- New options for controlling the range of values used in setting plot axes.
- The addition of heifer and cow conception rate evaluations.
- Code speed-ups that substantially reduce the amount of time for queries to run.
- Elimination of a programming error that prevented animal identification (ID) information from linking to animal records correctly.
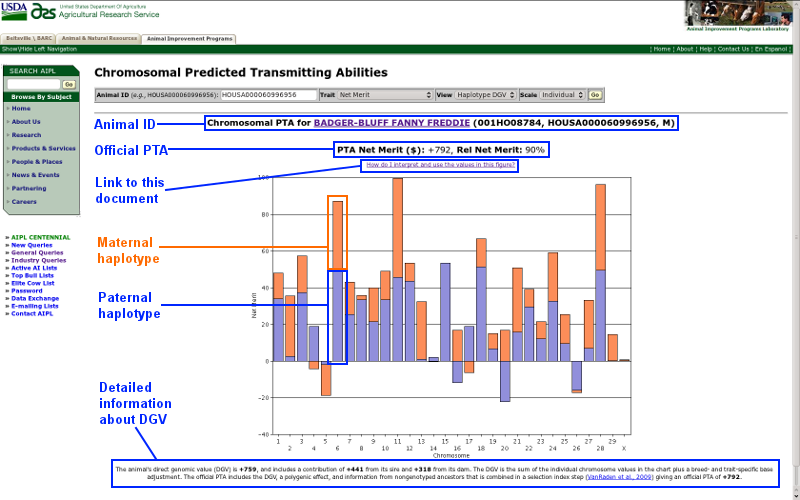
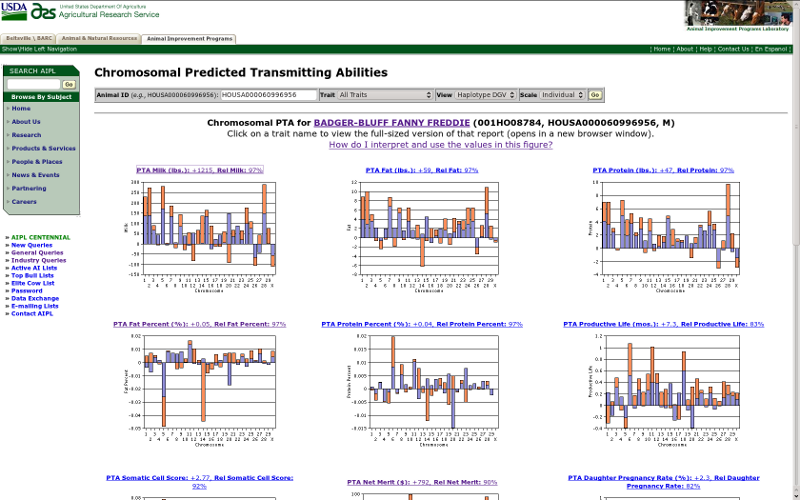
The chromosomal PTA query searches the Animal Improvement Programs Laboratory (AIPL) database and returns genetic evaluation information for genotyped Brown Swiss, Holstein, and Jersey bulls and cows. This section of the documentation describes the information presented on the query results screen, an example of which is shown in Figure 1. Each labeled item is described below. For detailed information about using the query, please skip ahead to the query controls section.
 |
| Figure 1. Results screen for the chromosomal PTA query. |
Animal ID
Animal ID information is displayed for each query and includes the animal's name (or ID number if no name is available), National Association of Animal Breeders code (for bulls), 17-byte American ID number, and sex code (F = female and M = male). The animal name/ID is a link that, when clicked, will open a new browser window that contains the animal's official genetic evaluation.
Official PTA
The animal's official PTA and reliability (Wiggans and VanRaden, 1989) are provided for the trait requested. For many (but not all) traits, a positive value is more desirable than a negative value. If you are not sure about the interpretation of a particular PTA, please refer to AIPL's documentation of calculations web page.
Link to this document
A link to this document is prominently placed on the results page.
Maternal haplotype
The orange bar represents the sum of the marker effects for the chromosome an animal received from its mother. Each bull and cow receive two copies of each chromosome, one from each parent. In turn, one copy of each chromosome is passed on to each of its offspring.
Paternal haplotype
The blue bar represents the sum of the marker effects for the chromosome an animal received from its father. Each bull and cow receive two copies of each chromosome, one from each parent. In turn, one copy of each chromosome is passed on to each of its offspring.
Detailed information about DGV
An animal's DGV includes a contribution from both its sire and dam as well as a breed- and trait-specific base adjustment. The official PTA includes the DGV, a polygenic effect, and information from nongenotyped ancestors that are combined in a selection index step described by VanRaden et al. (2009).
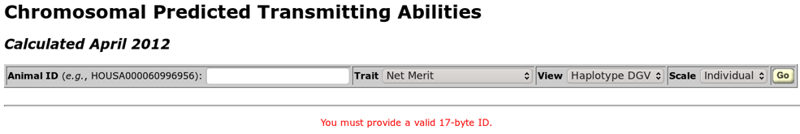
The chromosomal PTA query is controlled with a toolbar near the top of the query screen (Figure 2). The only information the user must provide is a 17-byte animal ID number. When no ID number has been provided, the message "You must provide a valid 17-byte ID" will be displayed in red text. To the right of the ID entry textbox are three pull-down menus that control other aspects of the plot, including the trait(s) to be shown, the values to be plotted, and the manner in which the axes for the graph should be displayed. The "go" button runs the query.
 |
| Figure 2. The chromosomal PTA query toolbar when the page is first loaded. |
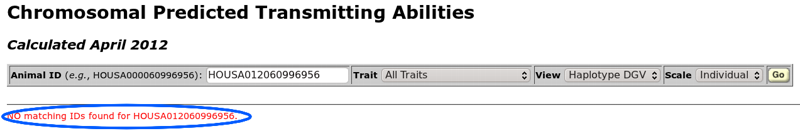
If an error is encountered when the query is run, a message will be displayed below the horizontal line under the toolbar. For example, Figure 3 shows the error message that is displayed when an animal ID cannot be found in the database. An ID number may be valid but associated with an animal that is not genotyped. If you are having trouble with an ID number, you should use the "get official bull evaluation" or "get cow evaluation" query tools to determine if an animal has a genomic evaluation. Both of those queries display a genomics indicator field (Genomics Ind), which tells you if an animal has been genotyped or not (0 = no, 1 = yes).
 |
| Figure 3. The error resulting from an unknown animal ID number. |
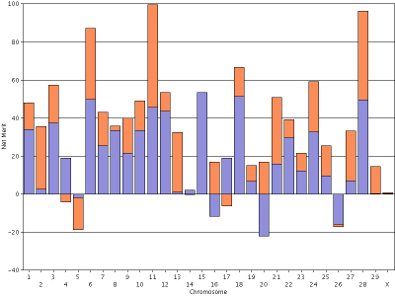
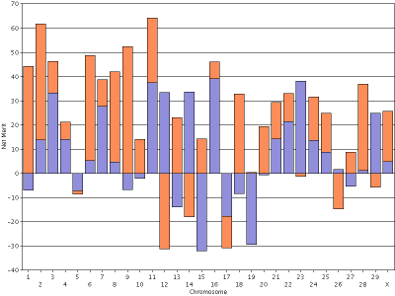
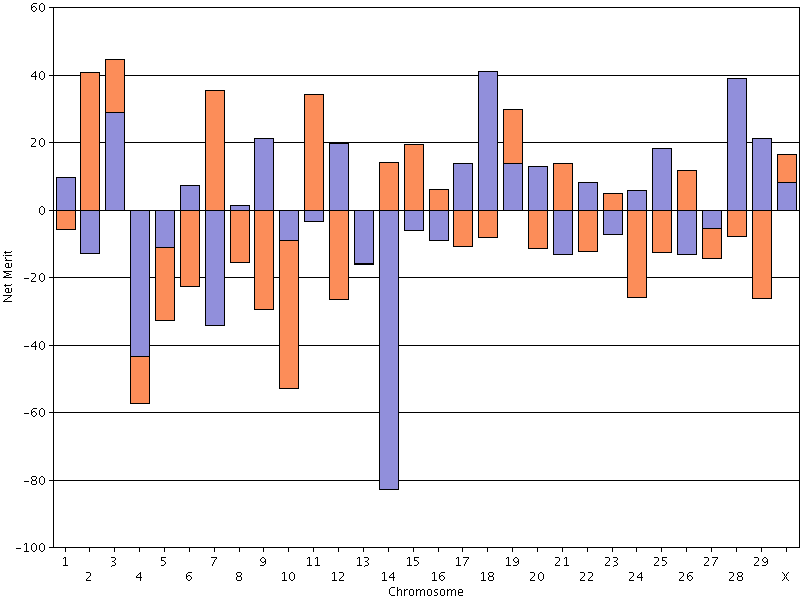
If you provide a 17-byte ID for a genotyped animal, you will see a result similar to Figure 4, which shows chromosomal PTA from Badger-Bluff Fanny Freddie's evaluation for lifetime net merit (Cole et al., 2009). By default, the query now shows the DGVs for the paternal (blue) and maternal (orange) chromosomes. If both haplotypes have a positive DGV, the sum is at the top of the bars. If both are negative, the sum is at the bottom of the bars. If one is positive and one negative, the sum is in the middle (halfway between the top and bottom).
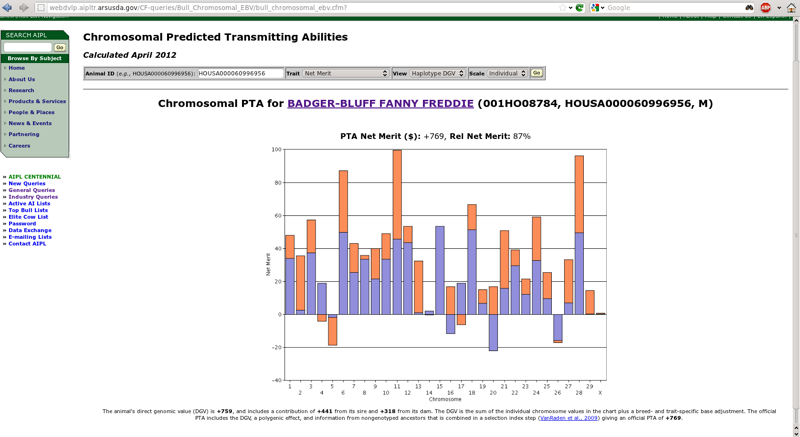 |
| Figure 4. Haplotype DGV for Badger-Bluff Fanny Freddie (HOUSA000060996956). |
Animal ID field
The ID entry field (Figure 5) accepts 17-byte ID numbers of the form "HOUSA000060996956" as well as shorter ID numbers such as "H60996956". A sex code is not usually necessary in the ID number (an 18-byte ID) because most ID numbers are unique. However, sometimes you will receive an error indicating that a 17-byte ID matches both a bull and a cow (Figure 6). In such cases, you should add an "M" (for a bull) or an "F" (for a cow) to the ID number following the three-character country code to create an 18-byte ID that will uniquely identify the animal.
 |
| Figure 5. The ID field in the query toolbar. |
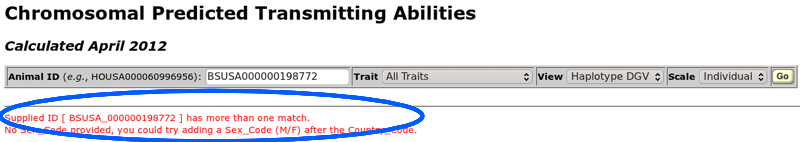 |
| Figure 6. A 17-byte ID number that is not unique and requires the addition of a sex code to create an 18-byte ID. |
Trait menu
The trait menu (Figure 7) is much simpler than the animal ID field because you do not have to provide any values — you just select the trait in which you are interested from the list. If you do not do anything but enter a 17-byte ID and click on the "go" button, lifetime net merit will be selected by default. As of April 2012, query results are available for 15 traits: milk yield, fat yield and percentage, protein yield and percentage, productive life, somatic cell score, lifetime net merit, daughter pregnancy rate, heifer and cow conception rates, sire and daughter calving ease, and sire and daughter stillbirth rates.
 |
| Figure 7. The trait menu in the query toolbar. |
If you select the "all traits" option from the traits menu, then the query will return a table including results for all 15 traits (Figure 8) rather than the single-trait view (Figure 4). If you click on the title for a trait in which you are interested, a new browser window will open with the regular view for that trait. Note that there are only 13 traits available for Brown Swiss and 11 for Jersey because of differences between breeds in the availability of PTAs for calving traits.
 |
| Figure 8. Haplotype DGVs of all traits for Badger-Bluff Fanny Freddie (HOUSA000060996956). |
View menu
The view menu (Figure 9) controls what information is plotted for the trait selected from the trait menu. There are two options available: haplotype DGV and summed DGV.
 |
| Figure 9. The view menu in the query toolbar. |
The default view is "haplotype DGV," which produces a chart showing the DGVs of the maternal and paternal haplotypes for each chromosome (Figure 4). The height of the bar for each haplotype is determined by adding-up the effects of all of the single nucleotide polymorphisms in each haplotype. Badger-Bluff Fanny Freddie has a high PTA for lifetime net merit because he generally received very good chromosomes from each parent, particularly for chromosomes 6, 11, and 28. In the cases where he received undesirable haplotypes from both parents (chromosomes 5 and 26), the poor chromosomes were not very bad compared with the good chromosomes in his genotype. In a few cases (chromosomes 4, 16, 17, and 20), he received one positive and one negative haplotype that tended to cancel each other out. Details about the calculation of haplotypes were provided by VanRaden et al. (2011).
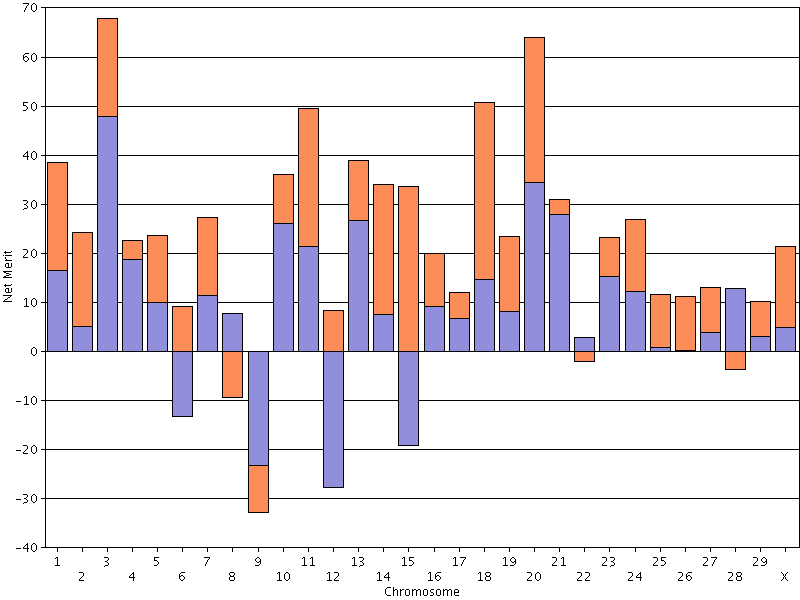
The other view menu option is "summed DGV," which produces a chart with the sum of all of the marker effects on both the maternal and paternal chromosomes (Figure 10). This is the plot produced by the original chromosomal PTA query, which tells you how good or poor an animal is for each chromosome but does not tell you anything about the value of individual haplotypes. The difference between the two reports is important because it is possible for an animal to have a positive value in the summed DGV report because it received two modestly desirable chromosomes (one from each parent) or one highly desirable chromosome and one chromosome with almost no desirability. In the first case, the animal's offspring would always receive a haplotype with a modest but desirable effect; however, in the second case, an offspring would receive one highly desirable chromosome half of the time and one chromosome with no desirability half of the time.
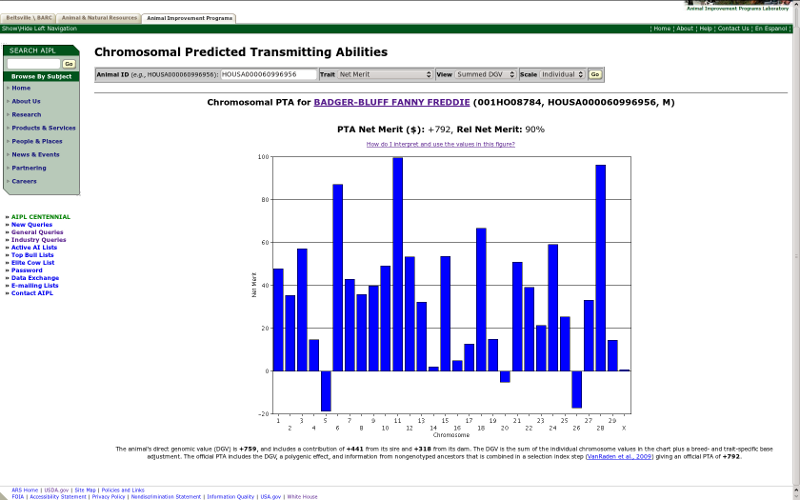 |
| Figure 10. Summed DGV of lifetime net merit for Badger-Bluff Fanny Freddie (HOUSA000060996956). |
Scale menu
The scale menu (Figure 11) controls the range of values used in setting plot axes. Two options are available: individual and shared.
 |
| Figure 11. The scale menu in the query toolbar. |
The default of "individual" scale sets the largest and smallest values on the y-axis using only information from the animal ID used for the query. This results in a plot that uses all of the available area for presenting the data (as shown in Figures 4 and 10). However, comparing query results for different animals is difficult with the individual scale because each animal's plot is on a slightly different scale. If you select the "shared" scale before submitting your query, the results will be plotted using a single y-axis scale for all animals. This makes it easier to compare one animal with another because two bars of the same height represent the same value when shared scales are used.
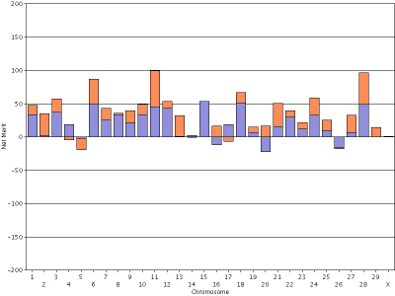
For purposes of comparison, the haplotype DGVs for lifetime net merit for the bull Badger-Bluff Fanny Freddie (HOUSA000060996956) and the cow Conant-Acres Gold Carla-ET (HOUSA000066153284) on individual scales are shown side by side (Figure 12). Comparing two animals using individual scales is difficult because bars of equal height do not represent haplotypes with equal values. The y-axis values in Freddie's genotype range from −40 to +100, whereas Carla's values range from −40 to +70. If you print the plots and arrange them such that the x-axis values of 0 are lined-up that does not fix the problem because the interval between the horizontal gridlines are different.
 |
 |
| Figure 12. Haplotype DGVs for lifetime net merit for the bull Badger-Bluff Fanny Freddie (HOUSA000060996956) (left) and the cow Conant-Acres Gold Carla-ET (HOUSA000066153284) (right) on individual scales. | |
In contrast, the haplotype DGVs for lifetime net merit for the bull Badger-Bluff Fanny Freddie (HOUSA000060996956) and the cow Conant-Acres Gold Carla-ET (HOUSA000066153284) on a shared scale (Figure 13) are easy to compare because bars of equal heights represent haplotypes with equal values.
 |
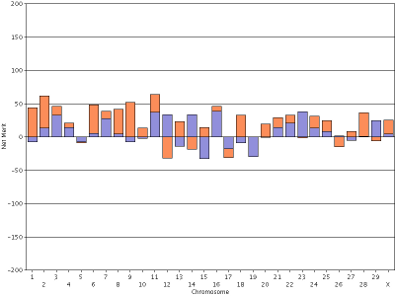 |
| Figure 13. Haplotype DGVs for lifetime net merit for the bull Badger-Bluff Fanny Freddie (HOUSA000060996956) (left) and the cow Conant-Acres Gold Carla-ET (HOUSA000066153284) right) using a shared scale. | |
"Go" button
After you've entered an animal ID number and made any changes you like to the default options, click the "go" button (Figure 14) to submit your query. If you want to accept the default values, you also may submit your query by pressing the "enter" key after you have typed the ID number in the animal ID field.
 |
| Figure 14. The "go" button in the query toolbar. |
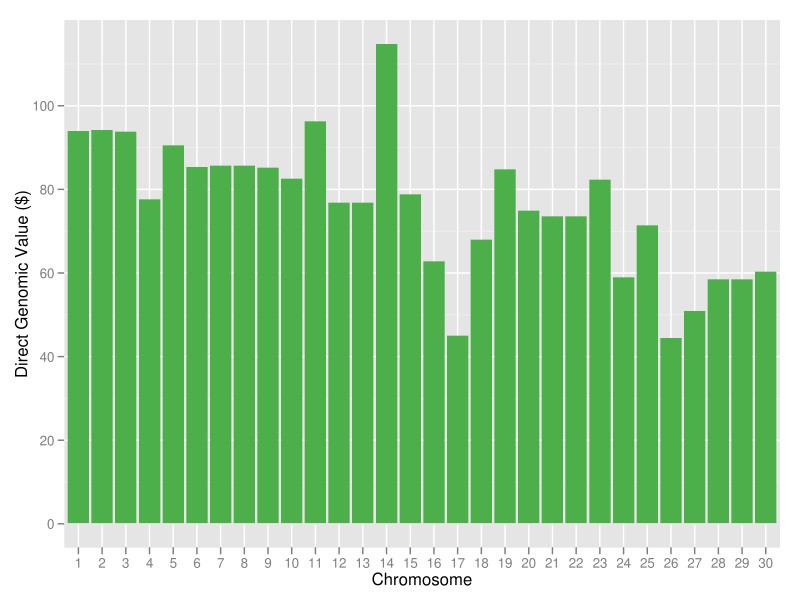
The best (green bars) and worst (purple bars) haplotypes in the Holstein breed as of April 2012 are shown in Figure 15. The most desirable Holstein haplotype is on chromosome 14, where the DGAT1 gene is located. The least desirable Holstein haplotype is on chromosome 18, which carries a quantitative trait locus that is associated with lifetime net merit, calving traits, and conformation (Cole et al., 2009). These results show a lot of variation between the best and the worst genotyped animals in the population, which is encouraging because it indicates that substantial genetic gain is possible using haplotypes already present in the population. So, how should you use haplotypes in your mating program?
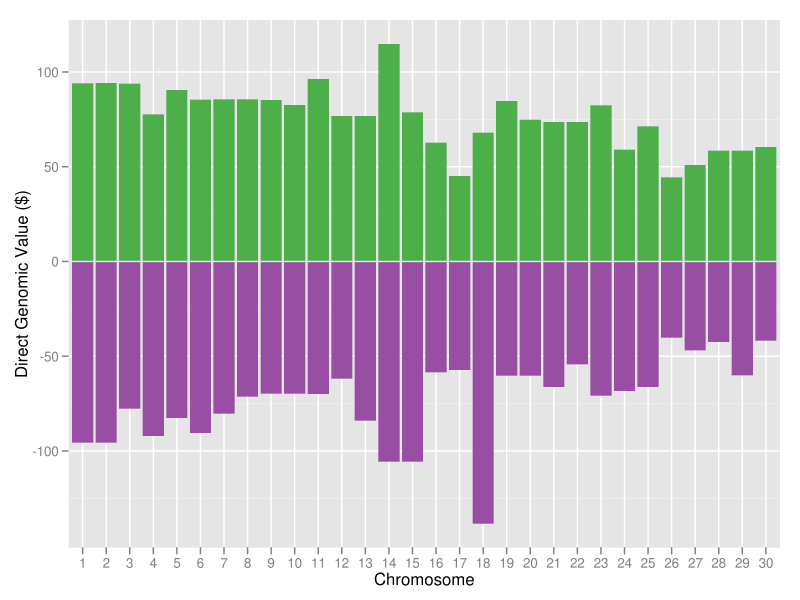 |
| Figure 15. The 30 best (green bars) and worst (purple bars) Holstein haplotypes for lifetime net merit. |
Ideally, you would like to produce an animal with a genome that includes all of the best chromosomes in the population. This could be done by identifying the animals with the best chromosomes and mating them in pairwise fashion to produce offspring that have the two best parental chromosomes (Cole et al., 2010). The offspring would then be mated in a similar fashion to produce individuals with four of the best chromosomes. In the best case, a series of 60 matings over five generations would be needed to produce such a "supercow" (Figure 16), which could then be propagated by embryo transfer or cloning. In reality, however, such an animal would be interesting only as a proof of concept because selection objectives change over time; the supercow of 2012 will not be the supercow of 2032. You should focus instead on using haplotypes to select specific mating pairs from a small group of candidates. Unfortunately, this is easier said than done.
 |
| Figure 16. Chromosomal DGVs for lifetime net merit for a hypothetical animal with a genotype that consists of the best haplotypes in the current U.S. Holstein population; the sum of the DGVs is +$2,286. |
Cole and VanRaden (2011) discussed some of the challenges in using haplotypes to plan matings. Two particularly important ideas are related to this: 1) independent assortment, and 2) crossovers. When gametes (spermatozoa and oocytes) are formed, each receives a random sample of the animal's haplotypes. Cattle have 30 chromosomes, which results in 230 (1,073,741,824) possible combinations of haplotypes. This huge number of combinations makes predicting which haplotypes an animal will receive from its parents almost impossible. If you are going to try and identify mating pairs based on their chromosomal DGVs, you should look for an individual that has a similar haplotype on each chromosome (for example, both positive or both negative depending on which is desirable). When a parent has one positive and one negative haplotype, you will get a desirable outcome only 50% of the time. The other challenge is that chromosomes crossover (two haplotypes physically "swap" pieces) during the process of gametogenesis, which shuffles the DNA. A crossover happens once per chromosome on average; therefore, an animal will most likely receive chromosomes from its parents that are mixtures of its grandparents' chromosomes. You are more likely to win the lottery than to correctly guess what combination of haplotypes a calf will have.
With all of that said, here are some things to consider when using haplotypes in your breeding program:
- If you are trying to produce a bull dam or young sire, you should set a minimum value for net merit PTA and select a mate at
or above that threshold that also has high Mendelian sampling variance (Figure 17). Preliminary research
suggests that identifying animals with large differences between haplotypes aross the genome is easier than finding an animal with
very high DGVs for all (or most) chromosomes.
It is important to understand that crossing-over tends to equalize Mendelian sampling effects by swapping material between chromosomes that are very different from one another. A parent may have big differences between its paternal and maternal chromosome, but those differences can be averaged-out due to crossing-over. - If you are interested in a uniform crop of calves for producing milk or milk solids, you should set a minimum value for net merit PTA and select a mate at or above that threshold and that has low Mendelian sampling variance (Figure
18). Animals with low Mendelian sampling variance have paternal and maternal haplotypes that are similar, which
means that you get a similar outcome regardless of which haplotype the offspring receives.
- Remember that the total genome matters most — both of
Badger-Bluff Fanny Freddie's haplotypes have negative DGV
for chromosomes 5 and 26 (Figure 4), but he has an excellent PTA for lifetime net merit. You should not
eliminate selection candidates because they have a few haplotypes with unfavorable DGVs. No animal in the national dairy
database has only positive DGVs for all chromosomes.
- Because independent assortment and crossing over are random processes, the outcome of a particular mating cannot be guaranteed. Haplotypes may be useful to help manage risk in your genetic program by identifying animals with acceptable variation among the paternal and maternal genomic contributions, but use of haplotypes does not guarantee that you will achieve a desired outcome. These data should be used carefully as part of an ongoing selection program. Research currently is underway to develop better tools for using haplotypes in mating programs.
 |
| Figure 17. Chromosomal DGVs for lifetime net merit for an animal with high Mendelian sampling variance. |
 |
| Figure 18. Chromosomal DGVs for lifetime net merit for an animal with low Mendelian sampling variance. |
Cole, J.B., and P.M. VanRaden. 2010. Visualization of results from genomic evaluations. J. Dairy Sci. 93:2727–2740.
Cole, J.B., and P.M. VanRaden. 2011. Use of haplotyes to estimate Mendelian sampling effects and selection limits. J. Anim. Breed. Genet. 128:446–455.
Cole, J.B., P.M. VanRaden, and Multi-State Project S-1040. 2009. Net merit as a measure of lifetime profit: 2010 revision. AIPL Res. Rep. NM$4(12-09).
Cole, J.B., P.M. VanRaden, J.R. O'Connell, C.P. Van Tassell, T.S. Sonstegard, R.D. Schnabel, J.F. Taylor, and G.R. Wiggans. 2009. Distribution and location of genetic effects for dairy traits. J. Dairy Sci. 92:2931–2946.
VanRaden, P.M., J.R. O'Connell, G.R. Wiggans, and K.A. Weigel. 2011. Genomic evaluations with many more genotypes. Genet. Sel. Evol. 43:10.
VanRaden, P.M., C.P. Van Tassell, G.R. Wiggans, T.S. Sonstegard, R.D. Schnabel, J.F. Taylor, and F.S. Schenkel. 2009. Invited review: Reliability of genomic predictions for North American Holstein bulls. J. Dairy Sci. 92:16–24.
Wiggans, G.R., and P.M. VanRaden. 1989. USDA-DHIA animal model genetic evaluations. NCDHIP Handbook, Fact Sheet H-2. Washington, DC.
Acknowledgments: The authors thank Paul VanRaden, Tabatha Cooper, and Tom Lawlor for valuable discussions about the query and documentation, and Suzanne Hubbard for her assistance with technical editing.
Stay Connected to ARS :